(following a randomnerdtutorials article)

Recently, Randomnerdtutorials published a string of articles on using Firebase to control or monitor your ESP8266 or ESP32 from basically anywhere in the world. These articles are very very worthwhile reading as they describe in detail making a Firebase hosted WebApp that allows you to do the above mentioned control. (another good resource is on arduino.cc).
Their gauge tutorial shows a pretty nice graphic front end, that is a good basis to add and expand on, as in fact they recommend in their tutorial, be it as an exercise or for a practical project.
Now I presume all die hard programmers already made their own projects, so for the not so die hard programmers, I will just explain the content of the various files a bit
So let’s have a look at the files: The most important files for the application are the index.html and index.js file.
If you want anything to appear on your screen, it has to go into your html file. What appears there depends on your index.js file (and how it appears depends on your css file)
The html and js files are pretty well structured (as is always the case with randomnerdtutorials). The index.js file for example, starts with some general functions to convert epoch time and plot values on a chart, defines some DOM (Document Object Module) elements, checks if the user is logged in and if yes, has a charts section (wanting to know how many points you want), a checkbox section, a cards section, a gauges section, a delete data section. a set up table section and if you are not logged in, it goes to login. All those sections are pretty well defined and commented, so it should not be too hard to put your own code in there as well.
So in fact the index.js file is a big If…then statement:
if logged in…then do a bunch of stuff, if not logged in, go to login.
The index.html file is equally structured, starts with the normal html stuff, then the various database things (domain/url/API/UID etc.).
It includes some libraries (highcharts for the graphs, fontawesome for some nifty icons and the Mikhus Gauges library). For the very purist developers….you could do without the gauges library, as highcharts can do gauges as well.
After that it is pretty well ordered again with clearly marked sections for graphs, gauges, cards etc. The gauges and charts themselves are handled in seperate js files. I should say though that it IS possible to download the highcharts library and use it locally. That may make sense for applications that do not use internet, but in this case it does not add much advantage.
I will not go in detail in the code of every change made, that would be too tedious, but the first one was easy and was just to ‘get into it’
Log in screen
Adding code for a tickbox to show the password was probably the simplest of all
 The original code in the index.html file looks like this looks like this:
 and we alter it like so:
 Now we could have put that function ‘myFunction’ in the index.js file, but it is just as easy to put it right where it is used.
Text cards
Then it is time to handle the ‘cards’ (where the sensor readings are shown in text). I wanted to add a reading in Fahrenheit, a pressure reading in mmHg and while I was at it add the dewpoint and a soil moisture reading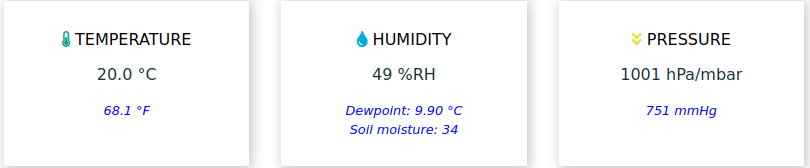
That was all pretty straightforward by adding text to the cards and adding proper javascript to the js file. For those with little experience in html and JavaScript: throughout the html file you will see sections of code that have an ‘id’ like: <canvas id="gauge-humidity">. The javascript code uses those identifiers to inject text in the html file, so it appears on your screen (yes, I know, very basic stuff, but not every beginner knows that), so in my code you will later see that I for instance have javascript calculate the fahrenheit temperature and then inject the result in a section of html that is identified by '<span id="fahrenheit">'
Gauges
The original WebApp did not have a gauge for pressure, so I added one and while I was at it, added some extra gauges as well.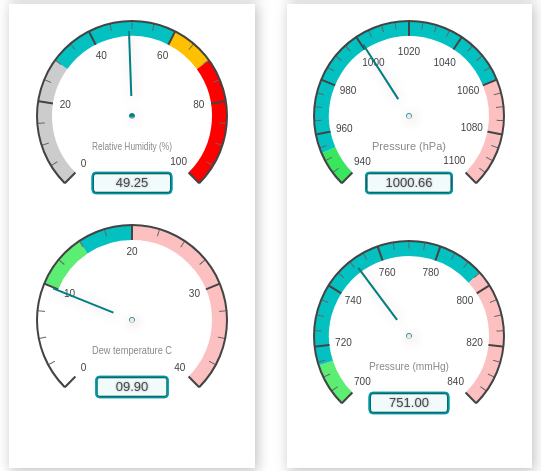
For that I had to add the gauge definitions to the ‘gauge-definitions.js file. Not so hard, basically copy paste from what is already there and change the parameters. and then ofcourse the regular additions in the index.html file and index.js file. In future I might change the thermometer gauge coz I find it a bit too rough and bulky.
Switches
I also wanted to add some switches. The original gauges app would only read data, but I wanted it to be able to switch some stuff on or off and I wanted some icons to change as well depending on the the switch being off or on like so: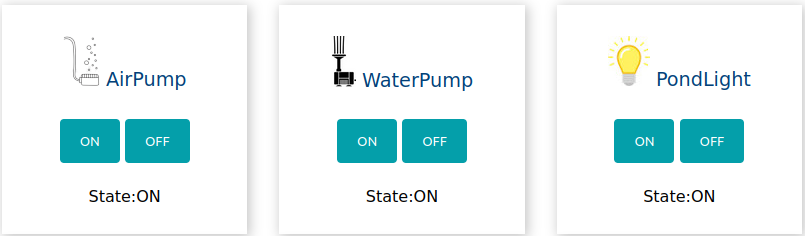
and so:
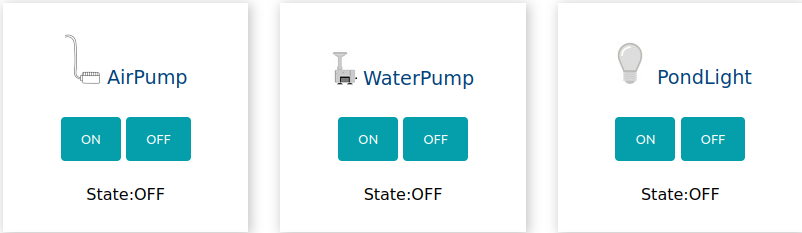
This was the biggest addition as it required a lot of new structure to be added to the files. What it does is that the switches set a 1 or 0 in the database (that is to be handled by an ESP ofcourse to actually switch a light or device on or off) and update their status (=the ON/OFF text in their card), depending on that status they define a path to 1 of two images, that is then ‘injected’ into the html file.
My html file for a specific button looks like this:
<!--CARD FOR GPIO 12-->
<div class="card">
<p class="card-title"><img id='img-w' width="25"> WaterPump</p>
<p>
<button class="button-on" id="btn1On">ON</button>
<button class="button-off" id="btn1Off">OFF</button>
</p>
<p class="state">State:<span id="state1"></span></p>
</div>
The various ‘id’-s will all be updated by JS code.
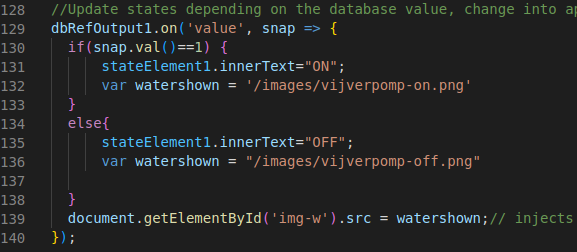
In that code the state is pulled from the database: if it is ‘1’ the text “ON” is injected into the HTML file (the ‘id’ for that was defined higher up in the js file as ‘state1’). It then defines a path to the ‘pump-on’ picture and injects that into the ‘img-w’ section in the html file.
Initially I wanted to use fantawesome.com icons, but their selection of free icons is limited and for some reason some of the free icons just did not show up, so I decided it was best to just make/modify some icons myself and store those in the WebApp
Level Switches
The next thing I wanted to add was the state of some level switches, including some icons that change with the state, so it would like this:
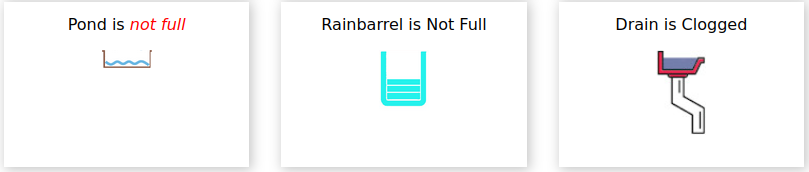
and this:
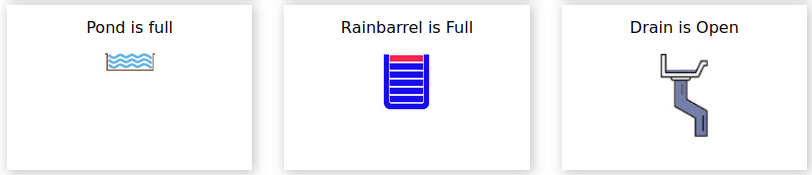
That may seem hard, but in fact it was not so bad as basically they are the same as the switches before with regard to reading a specific state from the database.
A word on the database
The database looks like this:
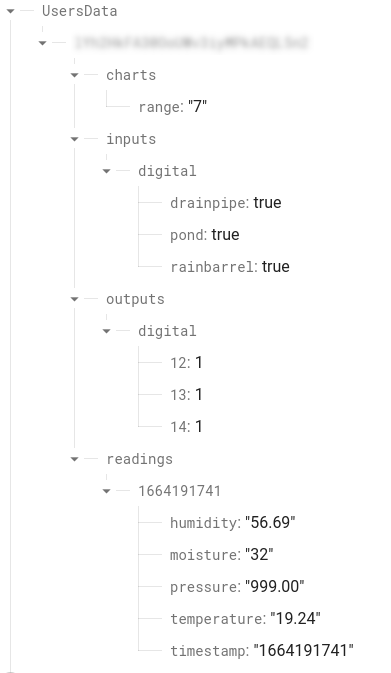
It is akin to the database from the original article with the difference that I added the ‘moisture’ field to the readings and added ‘inputs’ (for my level switches) and ‘outputs’ (for my switches). Ofcourse I could have added my level switches to the ‘readings’ records, but as i am not really interested whether my pond was full 2 weeks ago, I store the switch values in records that are to be overwritten by the most up to date value.
I suggest you read part 1 of the gauge tutorial (Check here for ESP32) at Randomnerdtutorials if you have not done so already. Set up firebase according to their description and run the ESP8266/ESP32 code in order to create the necessary database.
To be clear, in this article I focused solely on the interaction between the WebApp and the Firebase RTDB. How you get the wanted data (sensors and buttons) in the database is a different matter and greatly depends on what project you are building. It could come from one ESP8266/32 or from various ESP’s. The randomnerdtutorials website has a number of firebase projects with ESP’s writing data to and receiving data from the firebase RTDB. Start with the ESP8266/ESP32 codes as mentioned in the previous paragraph and you already covered most of it.
You will find the files here.
I will not include the pictures, as your project may have no need for those specific pictures and i am also not entirely sure if I can distribute them.
Update: if you want to store or print your table data: look here on how to do that.

Exactly what i was looking for. Appears to work great, thanks
Thanks Hào. Glad it helped you
Can we save the table?
At your command Hao: https://arduinodiy.wordpress.com/2022/10/01/exporting-your-html-table-to-csv/ Printing or downloading