In a previous article I described how to use InfluxDB to collect data from an ESP8266 and present that in Grafana or Chronograf. Grafana can also be used to present data that has been collected in a MySQL or MariaDB database. If you want your data as a graph, make sure that the data is stored as a number (albeit an int or a double or a float). If it is stored as a string, Grafana can only put it in a Table.
Suppose one has an SQL database called ‘esp-data’ that has a Table called ‘Sensor’ with the following structure:

That can be presented in Grafana as a graph (or a table), but we need to prepare a few things: It is best to make a user that has only ‘Select’ priviliges. That is because the SQL statements we use later in Grafana could influence your data when a mistake is made. In order to create a new user go into MySQL, typemysql -u yourusername -p
then: CREATE USER 'grafana' identified BY 'GRAFANA'
followed by: GRANT SELECT ON * TO 'grafana'
This created a usr called ‘grafana’ with password ‘GRAFANA’.
You may also need to configure your MySQL for remote access, but for now we leave it as is. I will come back to that later.
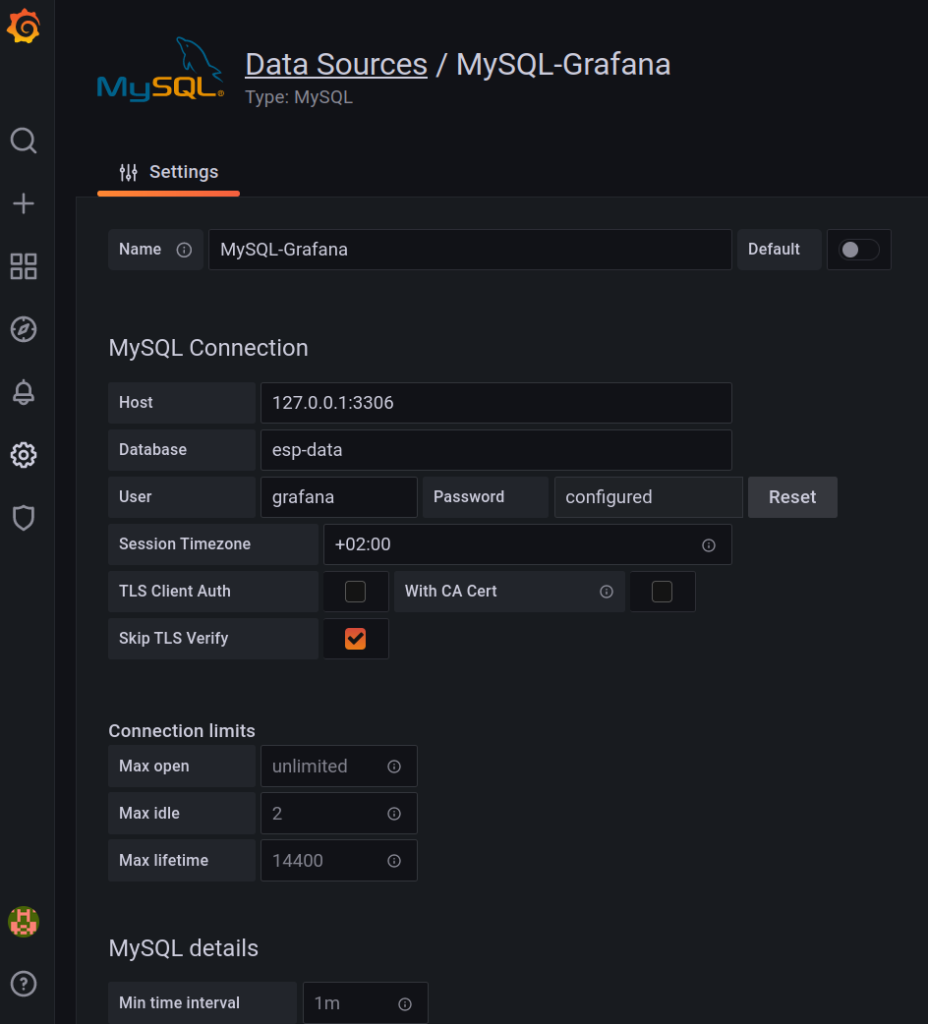
Next thing to do is to go to your grafana interface. You will find that at the computer it is installed on, at port 3000. So type ‘localhost:3000‘ in your browser. When it opens up, go to ‘datasources’. after logging in, go to the cogwheel in the left column and choose ‘Data sources’. Then pick ‘MySQL’ and fill in the details below. Ofcourse you can give the datasource another name than I did and/or choose another timezone. Then click “test and Save” and if everything goes well, you should have the connection made. (note: the image shows ‘password configured’ as i already entered the password. You will still need to enter the ‘GRAFANA’ password)

If however you get an error, there can be a number of possibilities. You will have to check the logfile at /var/log/grafana/grafana.log to see what exactly went wrong. What usually goes wrong is that you didn’t create the right user, that your timezone was an unknown format (remove it to make sure), or that MySQL was not started.
What can also cause a problem is when your MySQL doesn’t accept remote connections. That can be fixed:
In your console type:
sudo nano /etc/mysql/mysql.conf.d/mysqld.cnf
In that file, look for this line:
bind-address = 127.0.0.1
Change it to:
bind-address = 0.0.0.0
Save and close the file. Restart the MySQL service with:
sudo systemctl restart mysql
When you have the connection established goto the ‘+‘ sign in the left colomn, choose: ‘Create’ and ‘ Dashboard’ and then ‘add new panel’.
Fill that in like so:

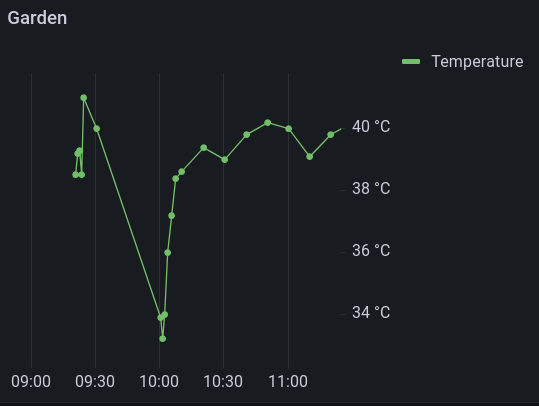
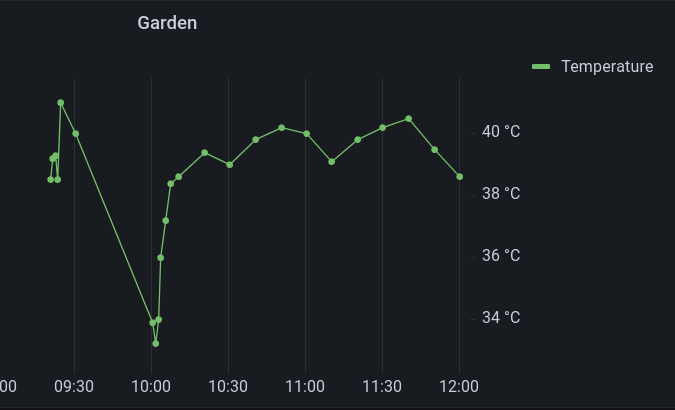
That will give you you a graph akin to this one, provided there is data in the time frame you have selected

The time frame to look at can be selected at the top of the screen:

Do not forget to save your dashboard!!
In this article I presumed you already had a MySQL database that was being filled by an ESP8266. If you do not, my advice is to not use MySQL/MariaDB but to pick InfluxDB, but if you insist on using MySQL, randomnerdtutorials has an excellent article on how to set up a MySQL database and fill it with an ESP8266. I also presumed you already had grafana running, if not, refer to the article linked at the top of this post