
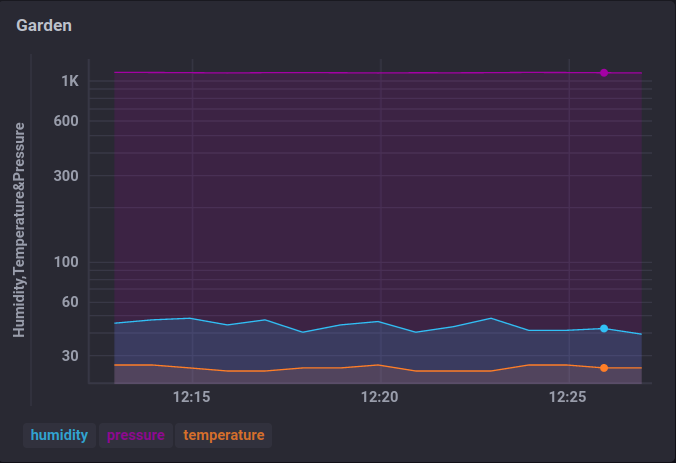
In an earlier post I referred to the use of InfluxDB and Grafana to store and present data. In this post I will explain how to do this and i will also add Chronograf, another graphics package.
There is a recent post of randomnerdtutorials on Influxdb as well, but where Rudy and Sarah discuss the use of a Cloud server (with only 30 days data retention in their free plan). For those interested, it might be good to know that recently InfluxDB allows filling a database through MQTT messages. I though will be using a local install of InfluxdB and will connect it to Grafana. As i am using Linux, that will be the install I will be discussing as that is the one I can test.
Install InfluxDB (Ubuntu)
One can use the Software manager for that, but I am not sure which version that will install (could be 1.6). I will do a manual install of version 1.8 (there is version 2, but I still prefer 1.8). (for other OS’s check here)
Type the following commando’s in your Command line
sudo curl -sL https://repos.influxdata.com/influxdb.key | sudo apt-key add -
sudo echo "deb https://repos.influxdata.com/ubuntu bionic stable" | sudo tee /etc/apt/sources.list.d/influxdb.list
sudo apt update
sudo apt install influxdb
Once influxdb is done installing, check the status
sudo systemctl status influxdb

In your case it will probably not say ‘active’ but more likely ‘dead’, as it is not running yet.
The next command will start it and make sure it is reloaded every time you start your system
sudo systemctl enable --now influxdb
Should you prefer a manual start, one can do that with
sudo systemctl start influxdb
Configure InfluxDB
type:
sudo nano /etc/influxdb/influxdb.conf
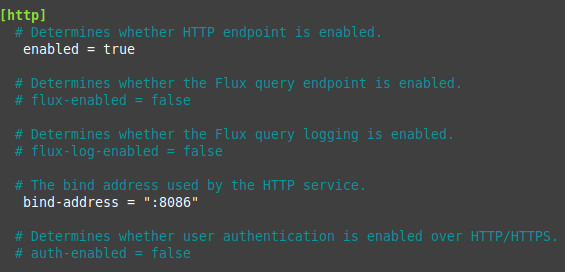
That will open the config file. Go to the [http] section and uncomment ‘enable = true’ and uncomment the bind-address
Save a the file and leave the editor with Ctrl-X and type ‘Y’ on the question ‘save file?’
Now restart influxdb with
sudo systemctl stop influxdb && sudo systemctl start influxdb
or with:
sudo systemctl restart influxdb
Now we need to create an admin account. as example I will call that account ‘john’ and as password I will use “JOHN”
curl -XPOST "http://localhost:8086/query" --data-urlencode "q=CREATE USER john WITH PASSWORD 'JOHN' WITH ALL PRIVILEGES"
once this is done, you can access influxDB with
influx -username 'john' -password 'JOHN'

Now create a database called ‘garden’ and check its creation with ‘show databases, as shown below

Now it is time to add some data. Make sure to use the right database with the command use garden
InfluxDB creates its fields ‘on the fly’, but the database needs a specific structure, like this:
<measurement>[,<tag-key>=<tag-value>...] <field-key>=<field-value>[,<field2-key>=<field2-value>...] [unix-nano-timestamp]
As the influxDB records are all time based, a timestamp is automatically added to the records. The tag keys are optional, the ‘measurement’ is not
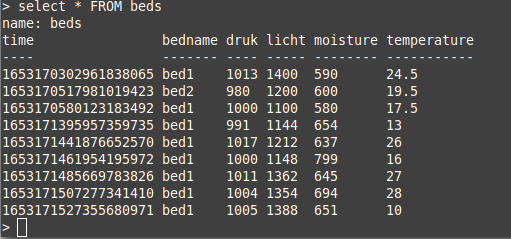
Anyway we will call the measurement ‘beds’ and add a tag-key ‘bedname’. Then we add 4 fields called ‘moisture’,’temperature’,’licht’ and ‘druk’ (the latter two being dutch words for ‘light’ and ‘pressure’, you may rename them).INSERT beds,bedname=bed1 moisture=590,temperature=24.5,licht=1400,druk=1013 and then show the record with the ‘select’ command

Add a couple of more records this way

Mind you that InfluxDB stores numbers as floats. If you specifically want to store them as integers, you have to add the suffix ‘i’, your command line should look like this:
INSERT beds,bedname=bed1 moisture=590i,temperature=24.5,licht=1400i,druk=1013i
Once you have sent a value that created a float, you cannot send integers to that field anymore.
As filling a database with manual commando’s is no fun, we will let the ESP8266 do that. For simplicity i will not read out any real sensors, but use random values, but you can easily replace those by a sensor of your choice:
#include <esp8266wifi.h>
#include <esp8266wifimulti.h>
#include <influxdb.h>
#define INFLUXDB_HOST "192.168.2.9"   //Enter IP of your device running Influx Database
#define WIFI_SSID "yourssid"     //Enter SSID of your WIFI Access Point
#define WIFI_PASS "yourPW"      //Enter Password of your WIFI Access Point
ESP8266WiFiMulti WiFiMulti;
Influxdb influx(INFLUXDB_HOST);
void setup() {
  Serial.begin(115200);
  WiFiMulti.addAP(WIFI_SSID, WIFI_PASS);
  Serial.print("Connecting to WIFI");
  while (WiFiMulti.run() != WL_CONNECTED) {
    Serial.print(".");
    delay(100);
  }
  Serial.println("WiFi connected");
  Serial.println("IP address: ");
  Serial.println(WiFi.localIP());
  influx.setDb("garden");
  Serial.println("Setup Complete.");
}
void loop() {
  InfluxData row("beds");
  row.addTag("bedname", "bed1");
  row.addValue("moisture", random(500,800));
  row.addValue("temperature", random(10, 40));
  row.addValue("licht", random(1100,1400));
  row.addValue("druk", random(980, 1023));
  influx.write(row);
  delay(20000);
}
(download here). After a while that will give:
If you wish you could add a line likerow.addValue("rssi", WiFi.RSSI()); which will add the WiFi signal strength.
Should you want to delete 1 or more records, do that with the ‘DROP SERIES command, like so:DROP SERIES FROM beds WHERE bedname='bed1'
In InfluxDB only tags or measurements can be part of this WHERE clause, fieldnames cannot. You can do all sorts of selections on the dataset, try for instance: select temperature from beds where time > now() - 5m.
That concludes the InfluxDB section, but let me just add a few words: This is version 1.8. Should you point your browser to localhost:8086, you will find a 404 error. In version 2 you supposedly will find a user interface.
Grafana (on Ubuntu)
Grafana can be installed via the software manager in Ubuntu, but if you want more flexibility, check this link. or this one (for various operating systems).
(Update: per June 7,2022 the newest version is 8.5.5. )
Install like this:
sudo apt-get install -y adduser libfontconfig1
wget https://dl.grafana.com/enterprise/release/grafana-enterprise_8.5.5_amd64.deb
sudo dpkg -i grafana-enterprise_8.5.5_amd64.deb
You can check your current version by going to any dashboard and go to settings:

After installation of Grafana, start it and go to http://localhost:3000.
The grafana user interface opens
In the left navigation of the Grafana UI. At the left hand side is a column with icons: hover over the gear icon to expand the Configuration section.
Click Data Sources.
Click Add data source.
Select InfluxDB from the list of available data sources.
On the Data Source configuration page, enter a Name for your InfluxDB data source.
Under Query Language, select either “InfluxQL” or “Flux”. I picked InfluxQL. I understand (but am not sure, that with InfluxDB version 2, picking Flux is the better option.
Under HTTP, you most likely will find ‘URL http://localhost:8086’.
Leave that for now, but we may have to revisit it.
Under Auth, select Basic auth
Under Basic Auth Details, enter:
Under InfluxDB Details, enter the following:
- User:-> john
- Password:->JOHN
Under InfluxDB Details
- Database: your database name -> garden
- User: your InfluxDB username: ->john
- Password: your InfluxDB password:-> JOHN
- HTTP Method: Select GET or POST:->POST
Once you are sure you filled out everything correct click “Save &Test“
Should you get an error saying it could not connect and you are sure you filled out everything correctly, go back to the URL field and change ‘http://localhost:8086’ into ‘http://ipnr-where-you-installed-InfluxDB:8086’ and try again. Pretty good chance your connection now will work.

Now go to the ‘+’ sign in the left hand column and Create- Dashboard and then ‘Pick an Empty Panel’

As we have 4 fields that we are interested in (temperature, moisture, light and pressure, we will be adding 4 fields. Under ‘Data source‘ pick the connection we created earlier (InfluxDB). Under ‘FROM–Select measurment‘ you should get the option ‘beds’ (which is the dataset we have been creating. Pick that one.
Under SELECT field, pick the field you want. I picked ‘Druk’ (=pressure). Under ALIAS type ‘Airpressure’ You should end up with this

Now add 3 more series in which you choose the other 3 channels and give them an appropriate ‘ALIAS’. Once your program has collected a number of data points, it should look something like this:
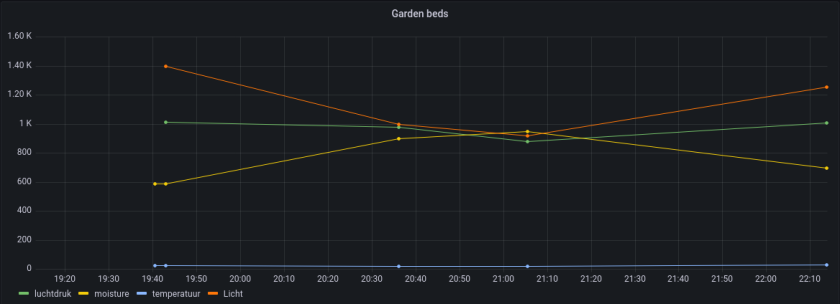
That is the basic setup of InfluxDB with grafana with an ESP8266.
Adding a BME280
So let’s now add a real sensor, like the BME280. That only requires a slight alteration of the program:
#include <ESP8266WiFi.h>
#include <ESP8266WiFiMulti.h>
#include <Wire.h>
#include <Adafruit_Sensor.h>
#include <Adafruit_BME280.h>
#include <InfluxDb.h>

#define INFLUXDB_HOST "host_ip_nr"   //Enter IP of device running Influx Database
#define WIFI_SSID "Your SSID"              //Enter SSID of your WIFI Access Point
#define WIFI_PASS "Your Password"          //Enter Password of your WIFI Access Point

ESP8266WiFiMulti WiFiMulti;
Influxdb influx(INFLUXDB_HOST);

//BME280
Adafruit_BME280 bme; // I2C
float temperature;
float humidity;
float pressure;

// Initialize BME280
void initBME(){
  if (!bme.begin(0x76)) {
    Serial.println("No valid BME280 sensor found");
    while (1);
  }
}

void setup() {
  Serial.begin(115200);
  WiFiMulti.addAP(WIFI_SSID, WIFI_PASS);
  Serial.print("Connecting to WIFI");
  while (WiFiMulti.run() != WL_CONNECTED) {
    Serial.print(".");
    delay(100);
  }
  Serial.println("WiFi connected");
  Serial.println("IP address: ");
  Serial.println(WiFi.localIP());

  influx.setDb("garden");
  initBME();//call BME280 initiation routine
  Serial.println("Setup Complete.");
}

int recordnr = 0;

void loop() {
  temperature = bme.readTemperature();
  humidity = bme.readHumidity();
  pressure = bme.readPressure()/100.0F;

  loopCount++;
  InfluxData row("beds");

  row.addTag("Sensor", "BME280");
  row.addTag("RecordNr", String(recordno));
  row.addValue("temperature", temperature);
  row.addValue("humidity", humidity);
  row.addValue("pressure",pressure);
  row.addValue("rssi", WiFi.RSSI());
  influx.write(row);

  Serial.print(String(recordno));
  Serial.println(" written to local InfluxDB instance");

  Serial.println();
  delay(60000);
}
A quick check of the database shows it is filling up:

Then we add 3 queries to our Grafana dashboard, like so:

repeat this for the pressure and temperature. Don’t forget to set proper names for the sensor readings under ‘ALIAS’ in the query.

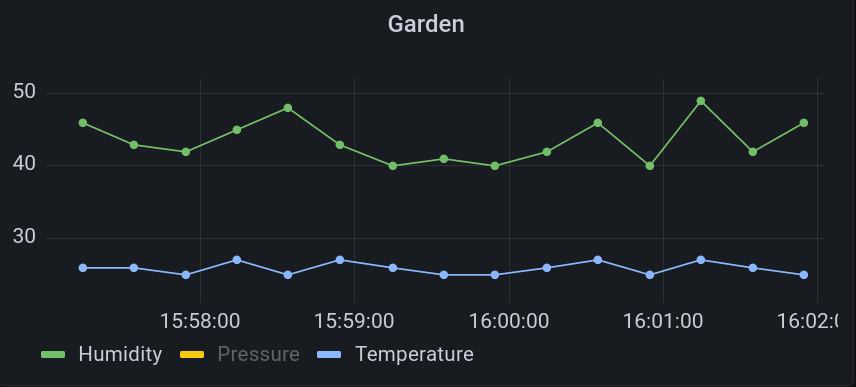
And now the dashboard will look like this:

If you only see dots instead of lines, go to the properties at the right side of your screen and set the following parameters

As you can see, the temperature and humidity are a bit pushed together because of the high value of the pressure readings. It is possible to only view a subset of the graph by clicking on the legends you want to see. Use shift-click for more than one line.
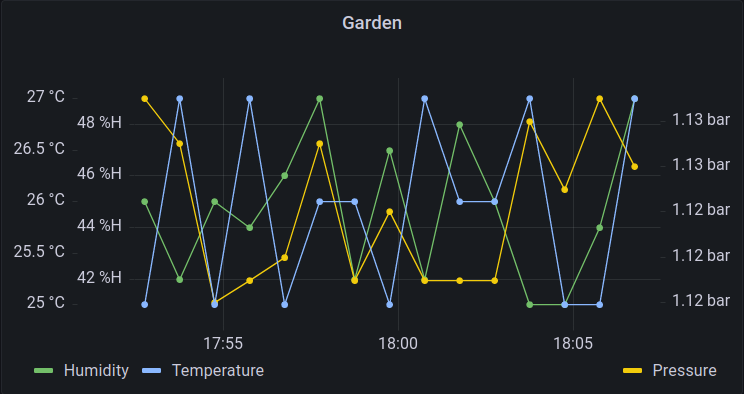
It is also possible to define mare than 1 and even more than 2 Y axis, each with their own scale:
Grafana offers a lot more possibilities and once you reached this point, it is best to just play around with the various options presented.
Don’t forget to save your dashboard.
Chronograf (on Ubuntu)
Chronograf is another package that can be used to present InfluxDB data, it is in fact from the same manufacturer. Installation is as follows:
wget https://dl.influxdata.com/chronograf/releases/chronograf_1.9.4_amd64.deb
sudo dpkg -i chronograf_1.9.4_amd64.deb
Then start the chronograf instance with:
chronograf
if you then go to localhost:8888 you will get:
Klik ‘Get started’ and configure your connection

Then add a connection. Choose ‘InfluxDB’

Subsequently you can add your fields, which will fill out the Query automatically

Under the ‘visualization button you can modify the properties of the graph.
Then use the green button to ‘send’ your query to the dashboard. The dashboard will open and at first you may be daunted by the many text windows telling you you need to install a plug-in.

Fear not as these all relate to functions/queries one CAN add (but doesn’t need to). Just scroll to the bottom and you will find the graphs you are looking for.

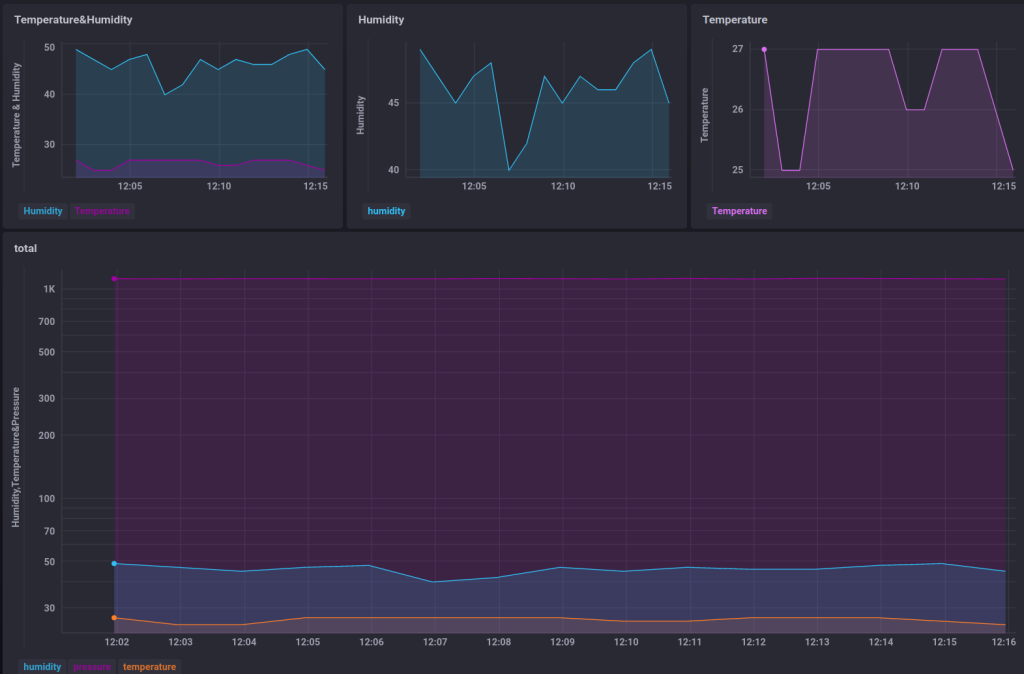
Ofcourse it is possible to combine queries in one graph, like so:
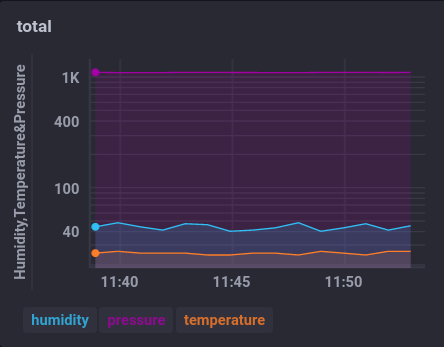
One can delete all the before mentioned text windows, which is a bit tedious. It is apparently possible to avoid these popping up by disabling the “_internal” database in a no doubt deeply hidden config file.
Summary
InfluxDB is a very versatile database that is different from and dare i say more flexible than databases as MySQL or MariaDB. Grafana and Chronograf are two extremely versatile graphic packages that can be used to present data from a number of sources, including influxDB. On a whole I found Grafana slightly easier to use and producing nicer graphs, but that is no doubt because i have more experience with Grafana than with Chronograf.