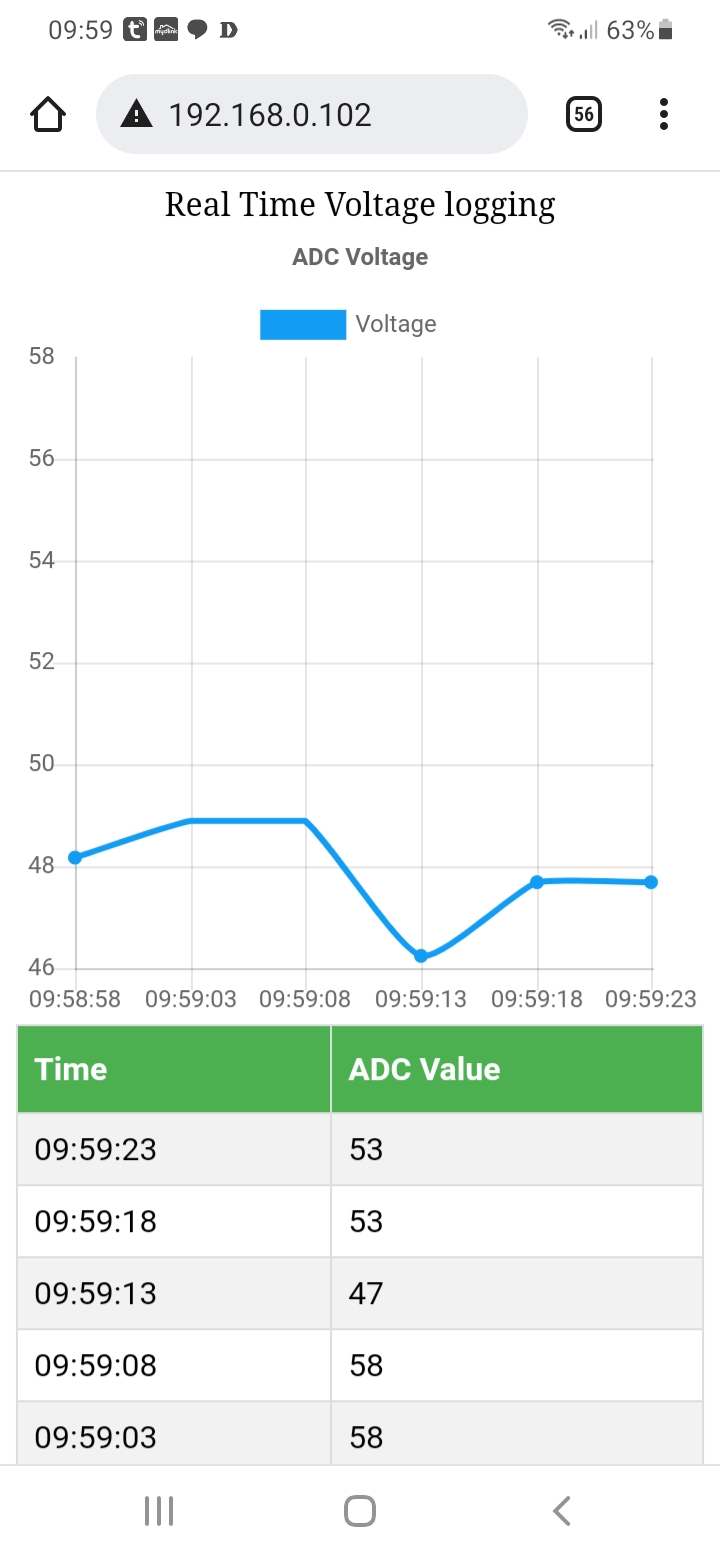
While scowering the internet for some hardware info on data logging i came upon a logging program (using chartjs) that seemed interesting at first, but that kept crashing my ESP8266 the moment the webpage was loaded. So I set out to find the fault and fix it. In the end it involved altering the entire structure of the program. (Edit: their program will work correctly if in the ‘void handleRoot()’ routine, they had changed String s = MAIN_page; to be String s = FPSTR(MAIN_page);.
Another issue with that program was that it loaded 4 fake values before it started recording some real values. This was obviously done to have some initial values in the graph during the first interval time. There is a better way to do that so I fixed that too. Finally, I made it suitable to be viewed on a tablet or phone as well.
This is the final program: (note, there is a mistake in the html because wordpress cannot display it correctly. Best get the file here.
/*
 * ESP8266 NodeMCU Real Time Graphs Demo
 * Updates and Gets data from webpage without page refresh
 */
#include <ESP8266WiFi.h>
#include <WiFiClient.h>
#include <ESP8266WebServer.h>

#define LED 2  //On board LED

//SSID and Password of your WiFi router
const char* ssid = "YourSSID";
const char* password = "YourPW";

ESP8266WebServer server(80); //Server on port 80
//---------------------
const char index_html[] PROGMEM = R"rawliteral(
<!DOCTYPE html>
<html>

<head>
  <title>Data logger</title>
  <meta name="viewport" content="width=device-width, initial-scale=1">
//the below line is wrong and wordpress cannot show the right way. The link should be in a 'script src=' tag and closed with '/script' html tag
  https://cdnjs.cloudflare.com/ajax/libs/Chart.js/2.7.3/Chart.min.js
  <style>
  canvas{
    -moz-user-select: none;
    -webkit-user-select: none;
    -ms-user-select: none;
  }

  /* Data Table Styling */
  #dataTable {
    font-family: "Trebuchet MS", Arial, Helvetica, sans-serif;
    border-collapse: collapse;
    width: 100%;
  }

  #dataTable td, #dataTable th {
    border: 1px solid #ddd;
    padding: 8px;
  }

  #dataTable tr:nth-child(even){background-color: #f2f2f2;}

  #dataTable tr:hover {background-color: #ddd;}

  #dataTable th {
    padding-top: 12px;
    padding-bottom: 12px;
    text-align: left;
    background-color: #4CAF50;
    color: white;
  }
  </style>
</head>

<body>
    <div style="text-align:center;">Real Time Voltage logging</div>
    <div class="chart-container" position: relative; height:350px; width:100%">
        <canvas id="Chart" width="400" height="400"></canvas>
    </div>
<div>
  <table id="dataTable">
    <tr><th>Time</th><th>ADC Value</th></tr>
  </table>
</div>
<br>
<br>

<script>
//Graphs visit: https://www.chartjs.org
var values = [];
var timeStamp = [];
function showGraph()
{
    for (i = 0; i < arguments.length; i++) {
      values.push(arguments[i]);
    }

    var ctx = document.getElementById("Chart").getContext('2d');
    var Chart2 = new Chart(ctx, {
        type: 'line',
        data: {
            labels: timeStamp,  //Bottom Labeling
            datasets: [{
                label: "Voltage",
                fill: false,
                backgroundColor: 'rgba( 18, 156, 243 , 1)', //Dot marker color
                borderColor: 'rgba( 18, 156, 243 , 1)', //Graph Line Color
                data: values,
            }],
        },
        options: {
            title: {
                    display: true,
                    text: "ADC Voltage"
                },
            maintainAspectRatio: false,
            elements: {
            line: {
                    tension: 0.2 //Smoothening (Curved) of data lines
                }
            },
            scales: {
                    yAxes: [{
                        ticks: {
                            beginAtZero:false
                        }
                    }]
            }
        }
    });

}

//On Page load show graphs
window.onload = function() {
  console.log(new Date().toLocaleTimeString());
  getData();
  showGraph();
};

//Ajax script to get ADC voltage at every 5 Seconds

setInterval(function() {
  // Call a function repetatively with 5 Second interval
  getData();
}, 5000);

function getData() {
  var xhttp = new XMLHttpRequest();
  xhttp.onreadystatechange = function() {
    if (this.readyState == 4 && this.status == 200) {
     //Push the data in array
  var time = new Date().toLocaleTimeString();
  var ADCValue = this.responseText;
      values.push(ADCValue);
      timeStamp.push(time);
      showGraph();  //Update Graphs
  //Update Data Table
    var table = document.getElementById("dataTable");
    var row = table.insertRow(1); //Add after headings
    var cell1 = row.insertCell(0);
    var cell2 = row.insertCell(1);
    cell1.innerHTML = time;
    cell2.innerHTML = ADCValue;
    }
  };
  xhttp.open("GET", "readADC", true); //Handle readADC server on ESP8266
  xhttp.send();
}

</script>
</body>

</html>
)rawliteral";
//--------------------

void handleRoot() {
 server.send(200, "text/html", index_html); //Send web page

}

void handleADC() {
 int a = analogRead(A0);
 String adcValue = String(a);
 digitalWrite(LED,!digitalRead(LED)); //Toggle LED on data request ajax
 server.send(200, "text/plane", adcValue); //Send ADC value only to client ajax request
}

void setup(){
  Serial.begin(115200);

  WiFi.begin(ssid, password);     //Connect to your WiFi router
  Serial.println("");

  //Onboard LED port Direction output
  pinMode(LED,OUTPUT);

  // Wait for connection
  while (WiFi.status() != WL_CONNECTED) {
    delay(500);
    Serial.print(".");
  }

  //If connection successful show IP address in serial monitor
  Serial.println("");
  Serial.print("Connected to ");
  Serial.println(ssid);
  Serial.print("IP address: ");
  Serial.println(WiFi.localIP());  //IP address assigned to your ESP

  server.on("/", handleRoot);
  server.on("/readADC", handleADC);
  server.begin();
  Serial.println("HTTP server started");
}

void loop(){
  server.handleClient();          //Handle client requests
}
The below picture shows what the corrupted line should look like, but best download the file from here.

Ofcourse choosing Influx and Grafana to store and show data is also a good choice.

It seems that some HTML code is gone aweay.
For example here
scale=1″>
https://cdnjs.cloudflare.com/ajax/libs/Chart.js/2.7.3/Chart.min.js
the and tags are gone but I am sure that they was there some days ago.
Here
there is a ” at the end that souldn’t be there. Maybe there are other errors too that I checked here
https://validator.w3.org/
Thanks. I will check. WordPress is just notoriously bad at displaying html code. Even when check and it looks fine and subsequently i need to open the edit again for say correcting a typo, the html can go haywire
here mean this, I forgot that html is interpreted also in comments
class=”chart-container” position: relative; height:350px; width:100%”
Tnx. Yes it is
Okay the correct line should be
div class=”chart-container” style=”position: relative; height:350px; width:100%”
eh no, it should have script tags around it. But wordpress just refuses to display those. You will find the full code here: https://gitlab.com/diy_bloke/esp8266datalogger/-/tree/main
okay the correct line should be
class=”chart-container” style=”position: relative; height:350px; width:100%”
This is an EXCELLENT example, thank you very much.
I have been searching for a simple and somewhat easy example of webpage data logger to use and found this and so glad I did.
This is one of the few I’ve tried that actually compiled and ran without having to search for and install obscure libraries or correct undefined stuff. Thank you for providing the link to the raw/clean code.
Now I have working code that I can change and modify, mine will log temperature readings.
Again….very good example.
Well done.
Thank you!
Thanks Bill, I am happy it helped you go further